For more information visit our Microsoft app source link https://appsource.microsoft.com/sv-se/product/power-bi-visuals/officesolution1640276900203.sales_velocity_compass_by_office_solution?tab=overview
Office Solution Capacity Monitoring tool enables organizations to track Centrally:-
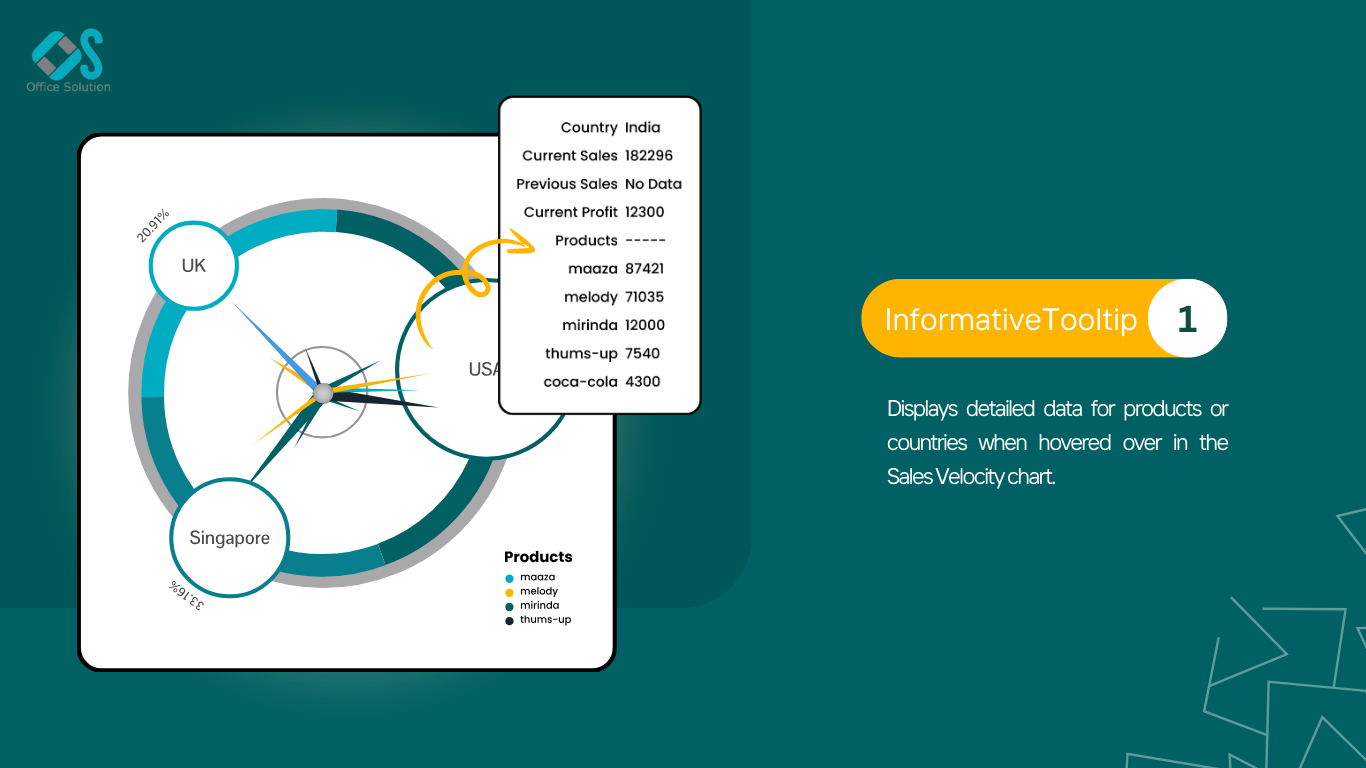
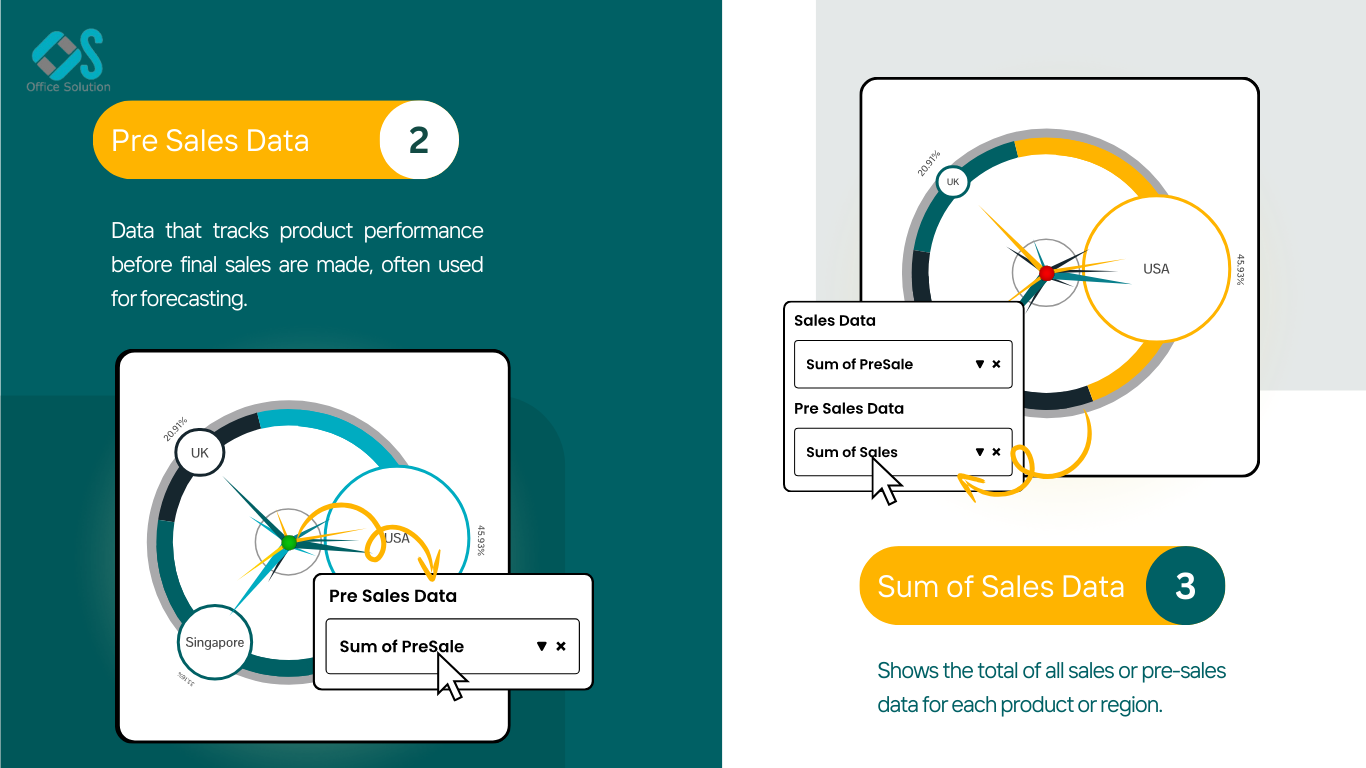
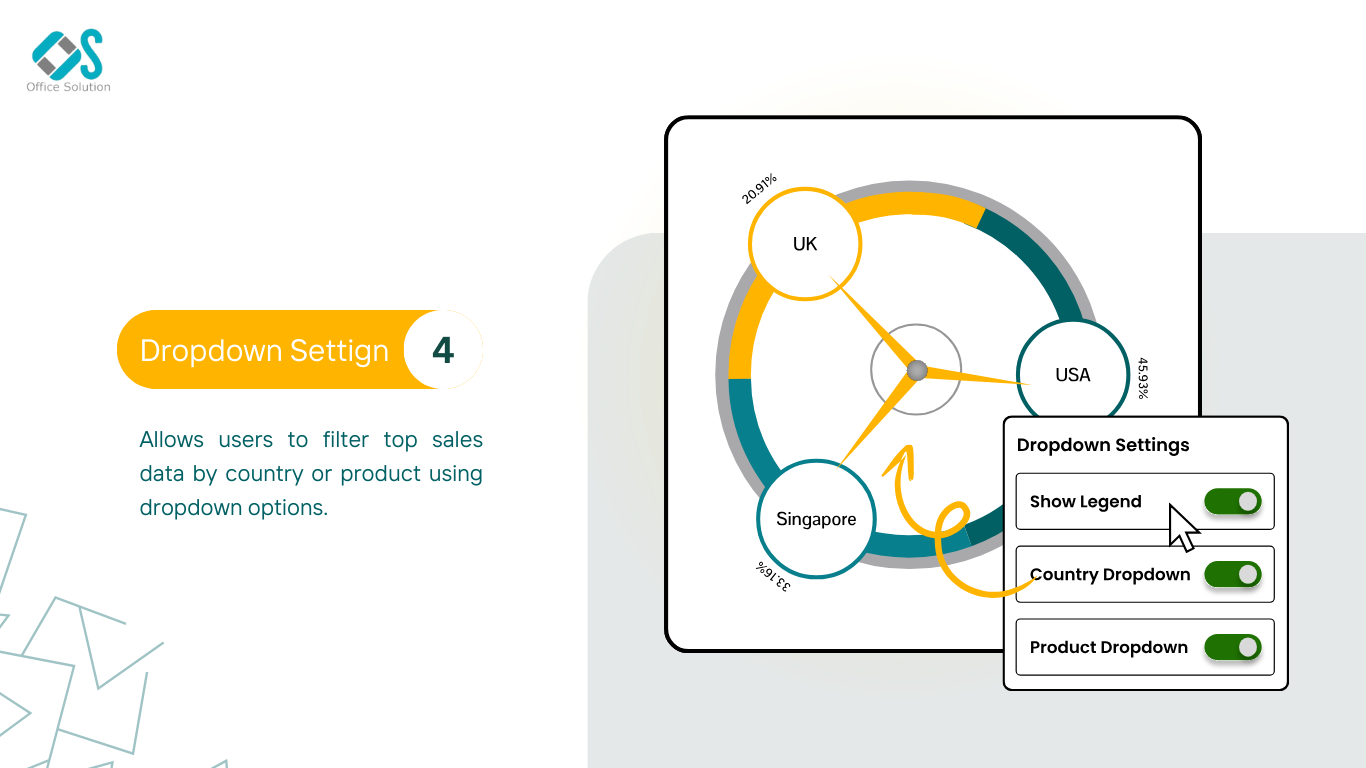
The polar scatter plot is a type of chart that displays data points in
Experience the versatility of Line and Scatter Plot Chart, where you c
Icon Array Chart by office solution transforms traditional data repres
The Magic Grid PBI Report Burst Solution is a Power B
Select Top N number of items to be displayed in chart and rest items w
Empower your data analysis with our Bar Chart featuring export capabil
The Hanging Rootogram chart is an advanced statistical visualization t