Tool Is Certified by Microsoft:


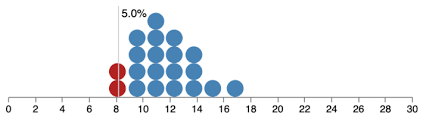
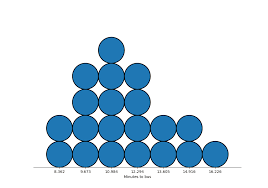
For more information visit our Microsoft app source link https://appsource.microsoft.com/en-us/product/power-bi-visuals/officesolution1640276900203.dot-plot-chart-by-office-solution?tab=overview
Office Solution Capacity Monitoring tool enables organizations to track Centrally:-

Lorenz Curve by Office Solution
T
The chart you are working with is designed to provide users with power
POWER BI LOAD TESTING SOLUTION
The "Custom Slicer by Office Solution" is a certified Power
Select Top N number of items to be displayed in chart and rest items w
Supply Chain Network Flow Chart