Tool Is Certified by Microsoft:

For more information visit our Microsoft app source link https://appsource.microsoft.com/en-us/product/web-apps/officesolution1640276900203.power-bi-premium-capacity-monitoring-solution
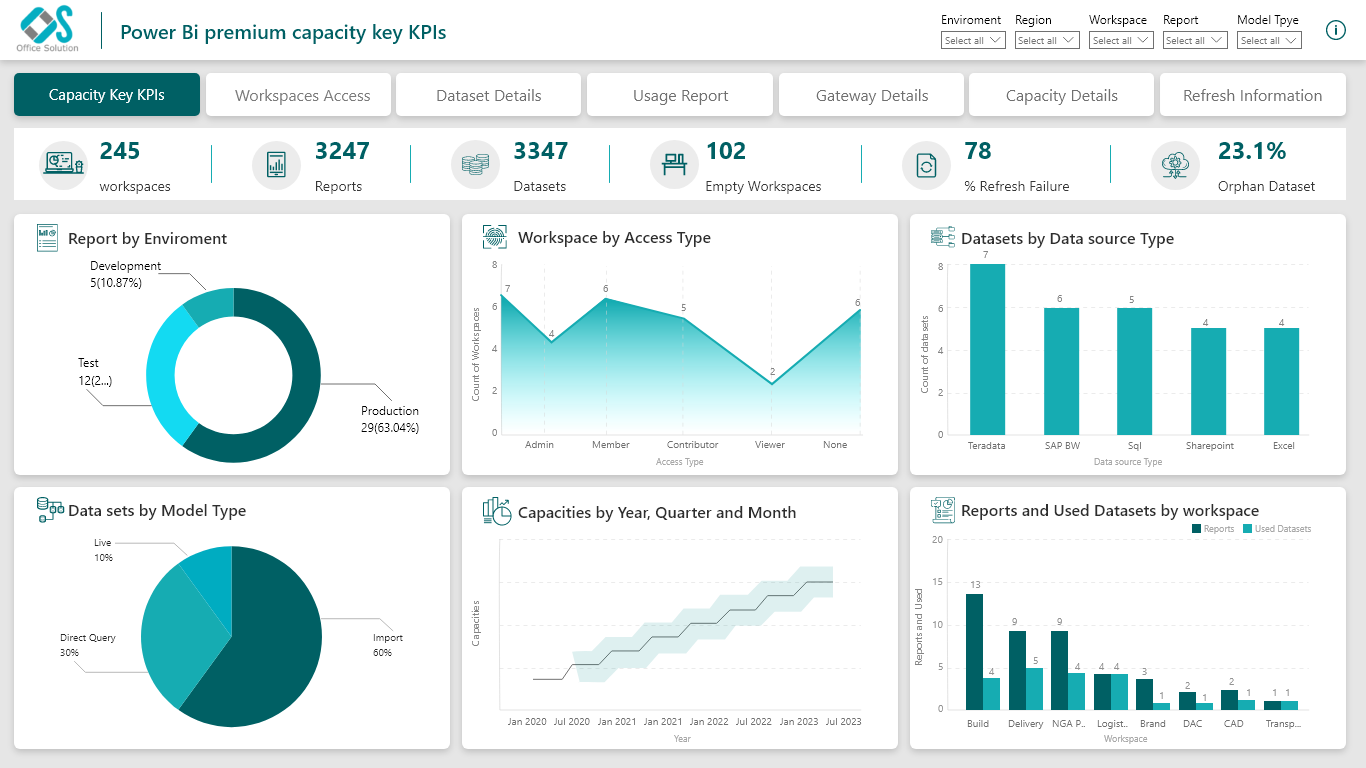
Office Solution Capacity Monitoring tool enables organizations to track Centrally:-
The chart you are working with is designed to provide users with power
Dynamic Price Elasticity Heat Map
The Magic Grid PBI Report Burst Solution is a Power B
POWER BI LOAD TESTING SOLUTION
Icon Array Chart by office solution transforms traditional data repres
A profit and loss statement summariz
The polar scatter plot is a type of chart that displays data points in