Tool Is Certified by Microsoft:

For more information visit our Microsoft app source link https://appsource.microsoft.com/en-us/product/web-apps/officesolution1640276900203.magic-grid-ai-ml-chatgpt-pbi-custom-dashboard?tab=Overview
Office Solution Capacity Monitoring tool enables organizations to track Centrally:-
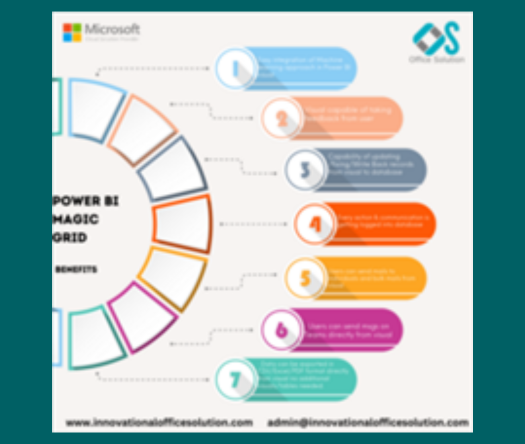
Power BI Magic grid which allows Write back into the database, ML Capa
POWER BI LOAD TESTING SOLUTION
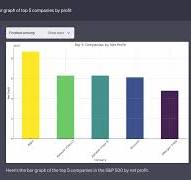
Empower your data analysis with our Bar Chart featuring export capabil
Select Top N number of items to be displayed in chart and rest items w
The Circular Dendrogram Chart offers a unique and vis
Supply Chain Network Flow Chart