Tool Is Certified by Microsoft:


For more information visit our Microsoft app source link https://appsource.microsoft.com/en-in/product/power-bi-visuals/officesolution1640276900203.connected-scatter-plot-chart-for-power-bi?exp=kyyw&tab=Overview
Office Solution Capacity Monitoring tool enables organizations to track Centrally:-
A quantile dot plot is a powerful visualization tool that represents t
Power BI Premium Capacity Analytics Solution Reduce your Power BI prem
Experience the versatility of Line and Scatter Plot Chart, where you c
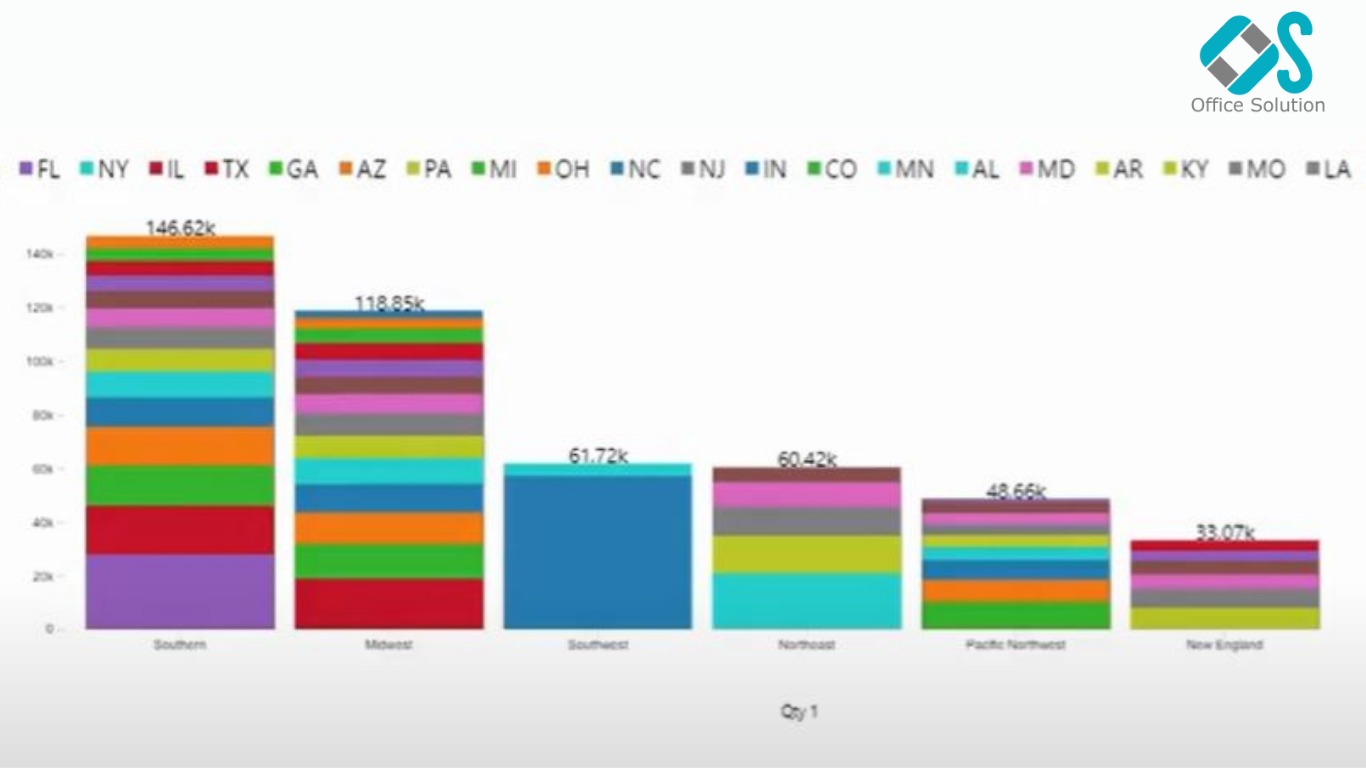
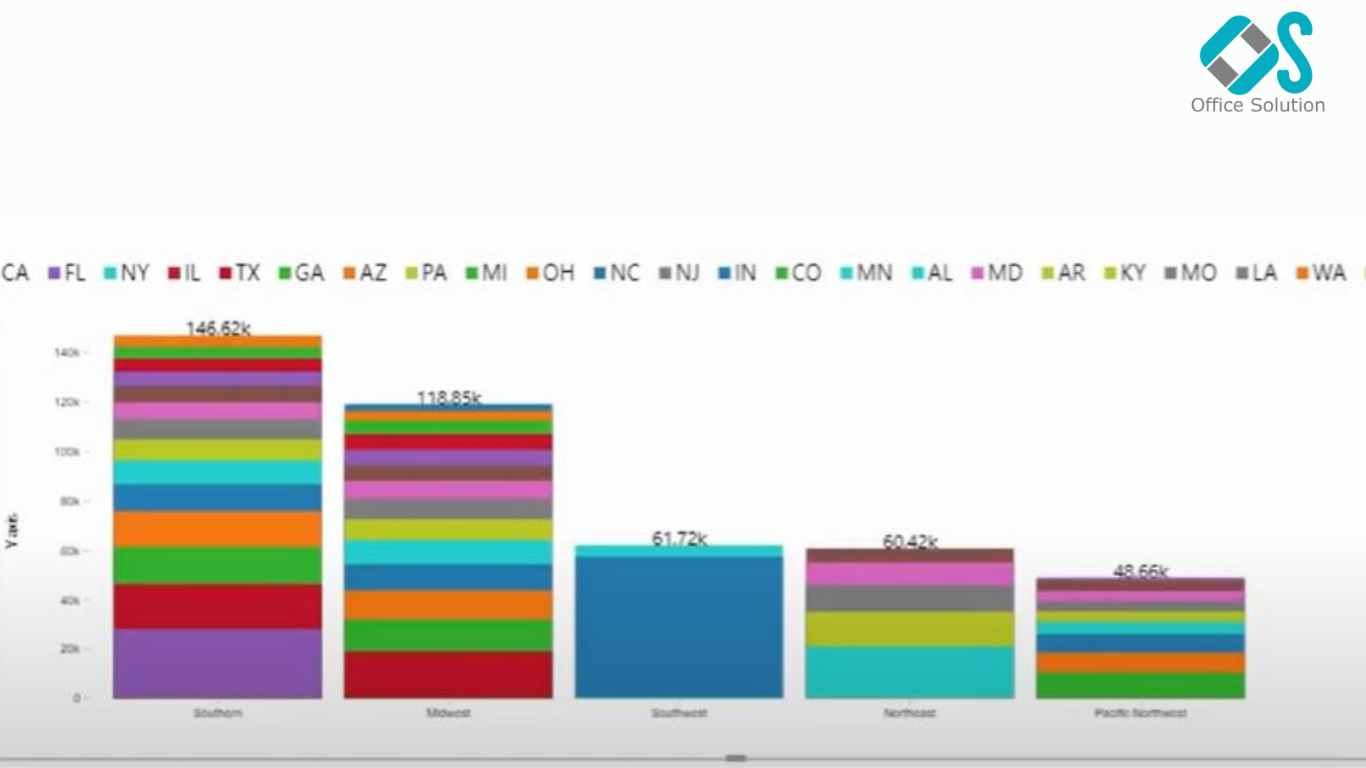
Empower your data analysis with our Bar Chart featuring export capabil
Connected Scatter Plot chart
Magic Grid Advanced Analytics ChatGPT Solution
The Hanging Rootogram chart is an advanced statistical visualization t