Deprecated: Optional parameter $condition declared before required parameter $column is implicitly treated as a required parameter in /home1/msoff2d9/public_html/bihubsolution.com/application/models/front/Apimodel.php on line 209

Deprecated: Optional parameter $like declared before required parameter $column is implicitly treated as a required parameter in /home1/msoff2d9/public_html/bihubsolution.com/application/models/front/Apimodel.php on line 209

Deprecated: Optional parameter $condition declared before required parameter $start is implicitly treated as a required parameter in /home1/msoff2d9/public_html/bihubsolution.com/application/models/front/Apimodel.php on line 230

Deprecated: Optional parameter $column declared before required parameter $start is implicitly treated as a required parameter in /home1/msoff2d9/public_html/bihubsolution.com/application/models/front/Apimodel.php on line 230

Deprecated: Optional parameter $condition declared before required parameter $like is implicitly treated as a required parameter in /home1/msoff2d9/public_html/bihubsolution.com/application/models/front/Apimodel.php on line 250

Deprecated: Optional parameter $orderby declared before required parameter $like is implicitly treated as a required parameter in /home1/msoff2d9/public_html/bihubsolution.com/application/models/front/Apimodel.php on line 250

Deprecated: Optional parameter $condition declared before required parameter $column is implicitly treated as a required parameter in /home1/msoff2d9/public_html/bihubsolution.com/application/models/front/Apimodel.php on line 278

Deprecated: Optional parameter $like declared before required parameter $column is implicitly treated as a required parameter in /home1/msoff2d9/public_html/bihubsolution.com/application/models/front/Apimodel.php on line 278

Product Detail

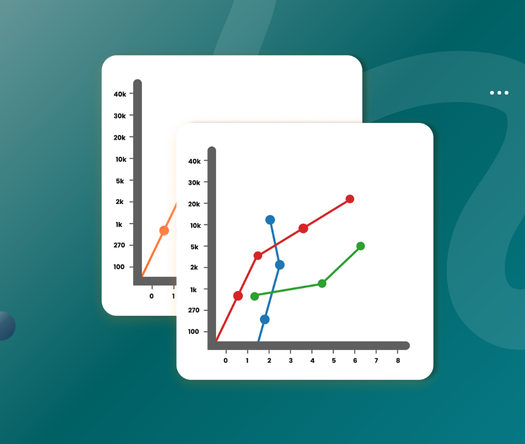
Connected Scatter Plot chart

Tool Is Certified by Microsoft:

Problem Statement

Organizations using Power BI face several challenges impacting reporting and decision-making. Performance issues arise due to time-consuming and costly load testing, while data export needs include retaining formatting in various formats (e.g., Excel, PDF). There's also a demand for ML integration for real-time analysis, and more dynamic visuals with customization options. Report bursting processes are often complex, and there's a need for advanced visualizations like Hanging Rootograms and Quantile Dot Plots for effective data analysis. These challenges hinder insights and slow data-driven decision-making, necessitating improved tools and processes.


4o mini

Conclusion

Addressing these issues is crucial for optimizing the use of Power BI, reducing costs, improving performance, and enhancing the overall data analysis and reporting experience.

Key Benefits include Visual Clarity for immediate data insight, a Dropdown Feature for selecting specific data, and Size Adjustment for dynamic resizability. Dynamic Data Handling ensures smooth performance with large datasets, while Customizable Dimensions offer flexibility in chart integration. Tooltip Functionality provides detailed data insights, and User-Defined Dot Colors enhance visual appeal. Premium Features include Logo Removal, Enhanced Dropdown Functionality, and advanced customization options. Use Cases span Financial Analysis, Health Research, and Environmental Studies. 

Other products

Office Solution Capacity Monitoring tool enables organizations to track Centrally:-

Tree View With Bar

Custom Tree View and Bar Chart, offering flexibility in managing column width and height, along w

Spiral Plot Chart

The Spiral Plot by Office Solution offers a unique way to visualize da

Promo Projection

Power BI Premium Capacity

Power BI Premium Capacity Analytics Solution Reduce your Power BI prem

Stacker Bar Chart With Top N

Select Top N number of items to be displayed in chart and rest items w

Circular Dendogram

The Circular Dendrogram Chart offers a unique and vis

Bar Chart Convertible with Scatter plot

Transform your Bar Chart into a dynamic Scatter Plot for enhanced data

Barley Trellis chart

The Barley Trellis chart, inspired by Becker et al.'s groundbreaki