Tool Is Certified by Microsoft:

For more information visit our Microsoft app source link https://appsource.microsoft.com/en-nz/product/power-bi-visuals/officesolution1640276900203.bar-chart-with-top-n-selection-by-office-solution?tab=Overview
Office Solution Capacity Monitoring tool enables organizations to track Centrally:-
Connected Scatter Plot chart
The Hanging Rootogram chart is an advanced statistical visualization t
Custom Tree View and Bar Chart, offering flexibility in managing column width and height, along w
The "Custom Slicer by Office Solution" is a certified Power
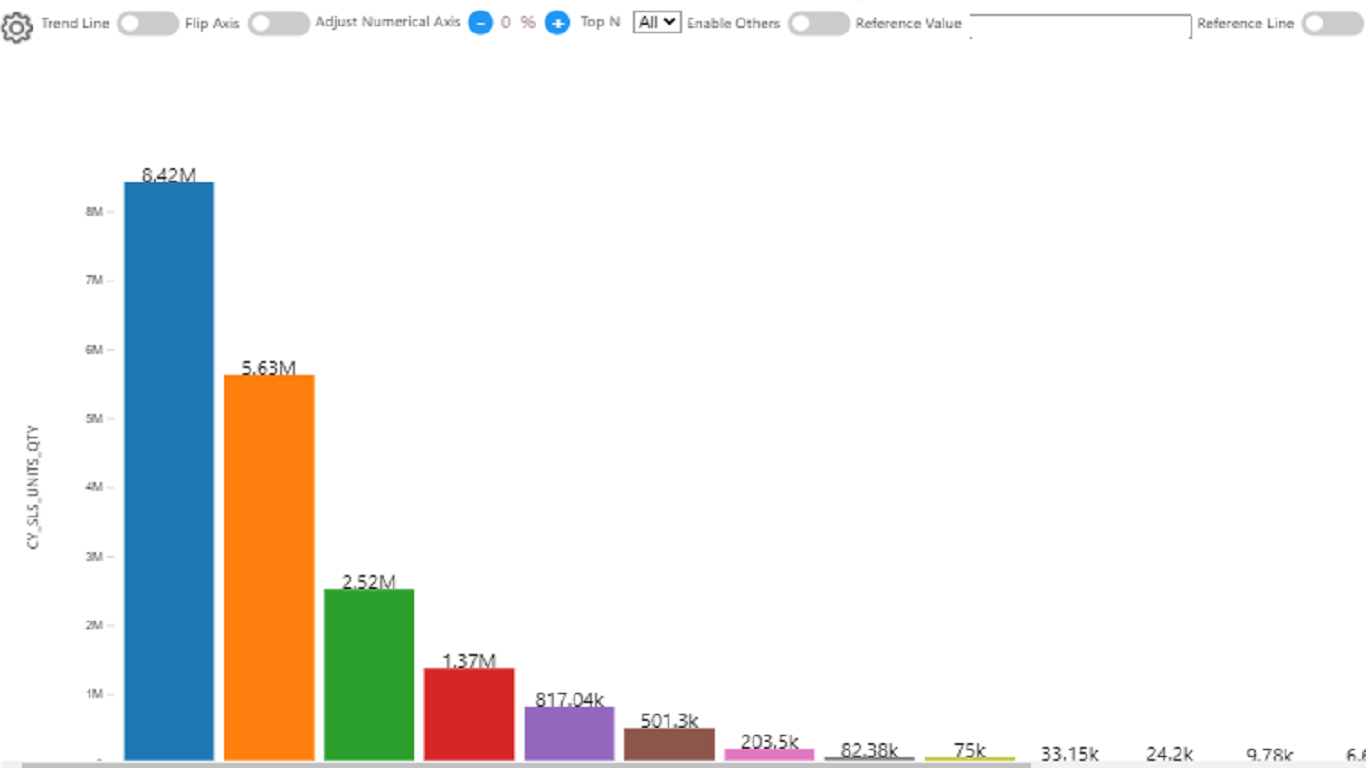
Empower users with dynamic bar charts, allowing real-time numeric aggr
Power BI Magic grid which allows Write back into the database, ML Capa
Supply Chain Network Flow Chart
Transform your Bar Chart into a dynamic Scatter Plot for enhanced data