Tool Is Certified by Microsoft:

For more information visit our Microsoft app source link https://appsource.microsoft.com/en-us/product/power-bi-visuals/officesolution1640276900203.bar-chart-with-export-data-feature
Office Solution Capacity Monitoring tool enables organizations to track Centrally:-
The Circular Dendrogram Chart offers a unique and vis
Supply Chain Network Flow Chart
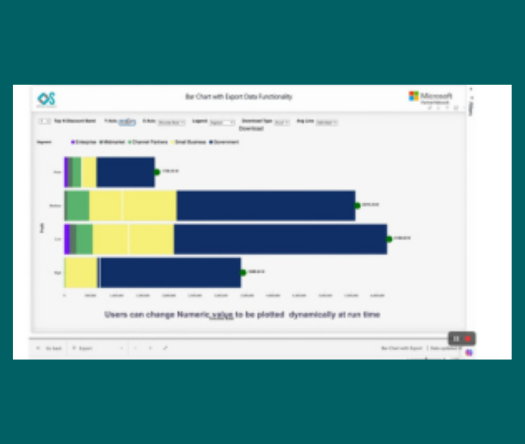
Empower users with dynamic bar charts, allowing real-time numeric aggr
The Hanging Rootogram chart is an advanced statistical visualization t
Power BI Magic grid which allows Write back into the database, ML Capa
Empower your data analysis with our Bar Chart featuring export capabil
The Magic Grid PBI Report Burst Solution is a Power B