Tool Is Certified by Microsoft:

For more information visit our Microsoft app source link https://appsource.microsoft.com/en-us/product/power-bi-visuals/officesolution1640276900203.bar-chart-run-time-convertible-in-scatter-plot?tab=Overview
Office Solution Capacity Monitoring tool enables organizations to track Centrally:-
The Circular Dendrogram Chart offers a unique and vis
The Magic Grid PBI Report Burst Solution is a Power B
POWER BI LOAD TESTING SOLUTION
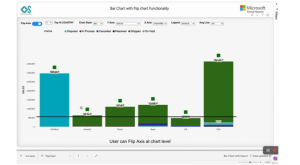
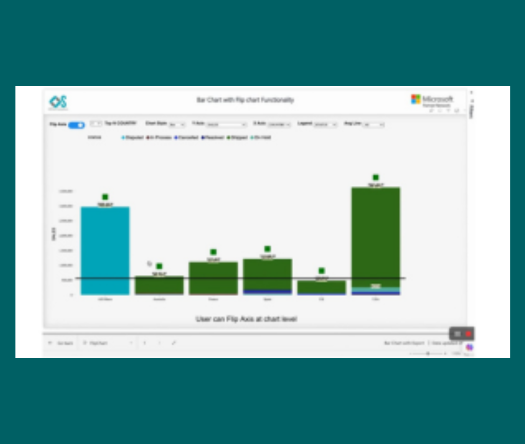
The chart you are working with is designed to provide users with power
Dynamic Price Elasticity Heat Map
Experience the versatility of Line and Scatter Plot Chart, where you c
Select Top N number of items to be displayed in chart and rest items w